 Ideal Tool to Create Flow Charts and Business Diagrams
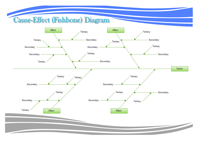
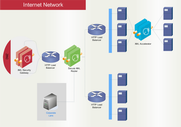
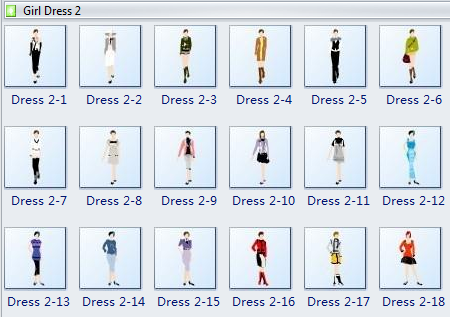
Versatile diagramming program, with features that make it perfect not only for professional-looking flow diagrams, organizational charts, business diagrams and charts, but also network diagrams, building plans, mind maps, workflows, fashion designs, UML diagrams, electrical engineering diagrams, science illustration… and that’s just the beginning!
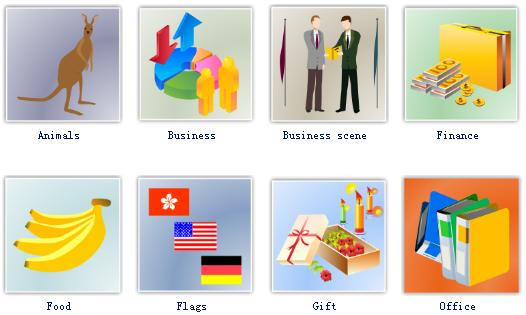
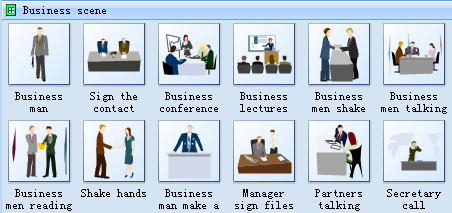
With more than 5000 built-in vector symbols, drawing couldn’t be easier! Create a wide variety of business charts and presentations based on free examples and templates while working in an intuitive and familiar Microsoft Office-style environment.
Create charts and diagrams to suit your requirements
In a corporate environment, the folks over in human resources need to be able to create organizational charts, some business presentations, and perhaps some directional maps and building floor plans to guide visitors through the facility. But, in the same company, the programmers and engineers also need software that lets them build UML diagrams, workflows, program structures, web design diagrams, electrical engineering diagrams, and database diagrams.
What’s the solution? Buy separate graphics programs for each department’s individual needs and hope your company approves the purchase? Buy one graphics program which suits one group but forces the others to compromise and make do? What about none of the above?
Edraw Max lets you create charts and diagrams to suit all of these requirements and much more. With over 5000 vector symbols included and an extensive library of pre-drawn illustrations, you’ll never have to purchase another graphics program ever again!
Easy and powerful flowchart software
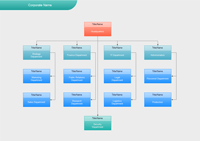
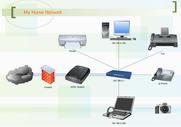
Using templates, shapes, and drawing tools, you’ll be able to intuitively build charts and diagrams that convey information more effectively than ever before. Using easy drag-and-drop design techniques, combined with automatic alignment and your choice of colors, fonts, and styles, building vector-based diagrams is quick and easy. Built-in examples facilitate the rapid creation of flowcharts, organizational charts, network diagrams and more.
If you are familiar with the Microsoft Office environment, you’ll pick up Edraw Max in no time. A key feature of Edraw Max is its flexibility. You can import existing Visio XML files, as well as a variety of graphics formats, and the projects that you create in Edraw Max can be exported in any graphics format, printed with full WYSIWYG support, or even shared with others as a standalone executable file. You can even link diagrams to underlying data to provide even more detailed information for your audience.
No other flowchart software gives you all this
Edraw Max is self-teaching software with dynamic help, designed to be easy enough for anyone to use without training, or manual, and there is almost no learning curve. Design and document based on a wide range of built-in shapes and free examples. Drawing couldn’t be easier!
Now a single user license allows one user to install the product on two computers as long as that user is the only user of the software. Edraw Max is a high quality product at an unbeatable price. Enjoy free maintenance updates and free technology support too.
Customer Reviews of our flowchart and diagram software
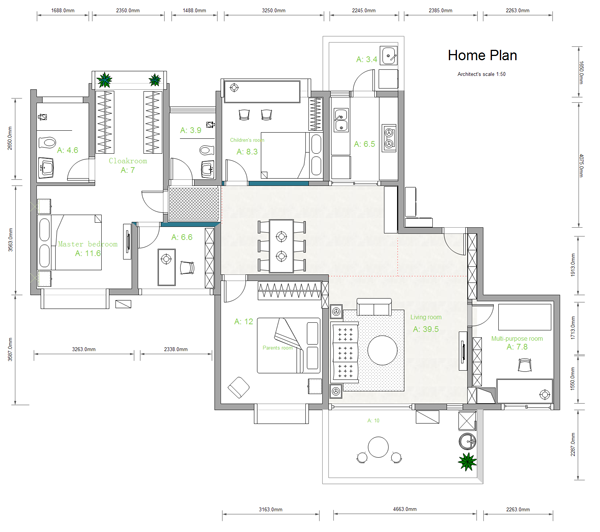
“Rather a light-weight yet incredibly powerful business graphics application that helps you with all of your drawing and graphing needs – from organization and flow charts – to database designs, home floor plans, and fashion design.”
“Create flow charts, organizational charts, building plans and network diagrams with minimal time and effort! A user friendly product – with good quality output – versatile (multipurpose).”
Ideal Tool to Create Flow Charts and Business Diagrams
Versatile diagramming program, with features that make it perfect not only for professional-looking flow diagrams, organizational charts, business diagrams and charts, but also network diagrams, building plans, mind maps, workflows, fashion designs, UML diagrams, electrical engineering diagrams, science illustration… and that’s just the beginning!
With more than 5000 built-in vector symbols, drawing couldn’t be easier! Create a wide variety of business charts and presentations based on free examples and templates while working in an intuitive and familiar Microsoft Office-style environment.
Create charts and diagrams to suit your requirements
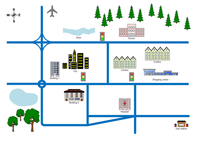
In a corporate environment, the folks over in human resources need to be able to create organizational charts, some business presentations, and perhaps some directional maps and building floor plans to guide visitors through the facility. But, in the same company, the programmers and engineers also need software that lets them build UML diagrams, workflows, program structures, web design diagrams, electrical engineering diagrams, and database diagrams.
What’s the solution? Buy separate graphics programs for each department’s individual needs and hope your company approves the purchase? Buy one graphics program which suits one group but forces the others to compromise and make do? What about none of the above?
Edraw Max lets you create charts and diagrams to suit all of these requirements and much more. With over 5000 vector symbols included and an extensive library of pre-drawn illustrations, you’ll never have to purchase another graphics program ever again!
Easy and powerful flowchart software
Using templates, shapes, and drawing tools, you’ll be able to intuitively build charts and diagrams that convey information more effectively than ever before. Using easy drag-and-drop design techniques, combined with automatic alignment and your choice of colors, fonts, and styles, building vector-based diagrams is quick and easy. Built-in examples facilitate the rapid creation of flowcharts, organizational charts, network diagrams and more.
If you are familiar with the Microsoft Office environment, you’ll pick up Edraw Max in no time. A key feature of Edraw Max is its flexibility. You can import existing Visio XML files, as well as a variety of graphics formats, and the projects that you create in Edraw Max can be exported in any graphics format, printed with full WYSIWYG support, or even shared with others as a standalone executable file. You can even link diagrams to underlying data to provide even more detailed information for your audience.
No other flowchart software gives you all this
Edraw Max is self-teaching software with dynamic help, designed to be easy enough for anyone to use without training, or manual, and there is almost no learning curve. Design and document based on a wide range of built-in shapes and free examples. Drawing couldn’t be easier!
Now a single user license allows one user to install the product on two computers as long as that user is the only user of the software. Edraw Max is a high quality product at an unbeatable price. Enjoy free maintenance updates and free technology support too.
Customer Reviews of our flowchart and diagram software
“Rather a light-weight yet incredibly powerful business graphics application that helps you with all of your drawing and graphing needs – from organization and flow charts – to database designs, home floor plans, and fashion design.”
“Create flow charts, organizational charts, building plans and network diagrams with minimal time and effort! A user friendly product – with good quality output – versatile (multipurpose).”
“Edraw offers fantastic value for money. If flow diagrams are all you need, Visio is a little overkill, and too expensive for my taste. Then I found Edraw, it’s incredible and increased my productivity. I just want to say Edraw is great value for money, and so easy to use!”
Click Here to View Video Tutorials on YouTube
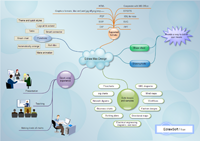
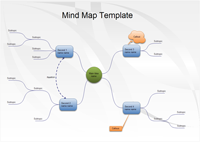
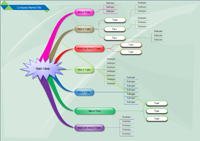
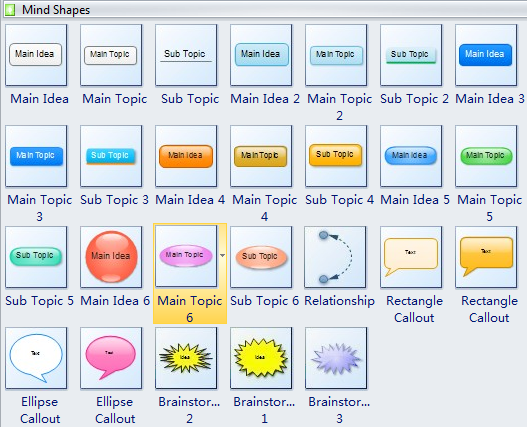
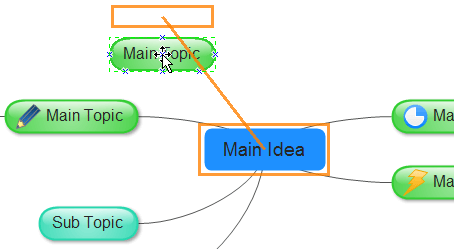
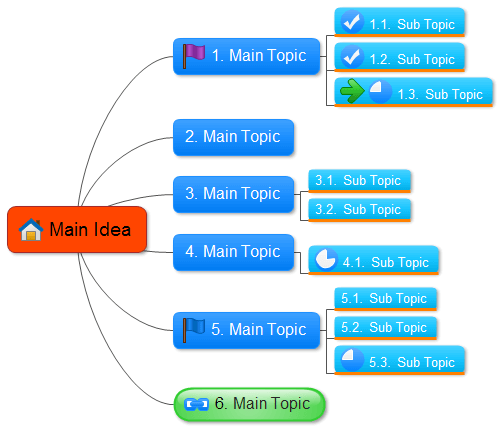
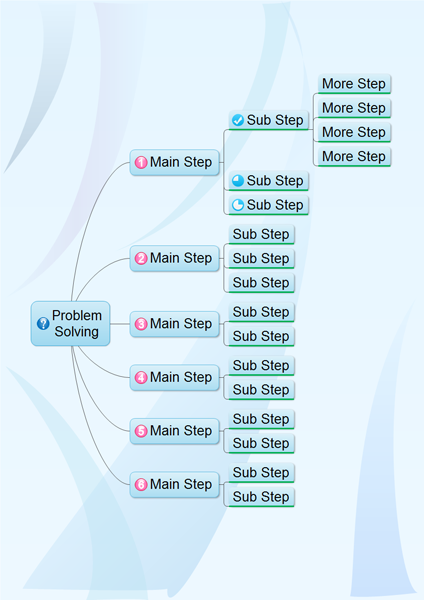
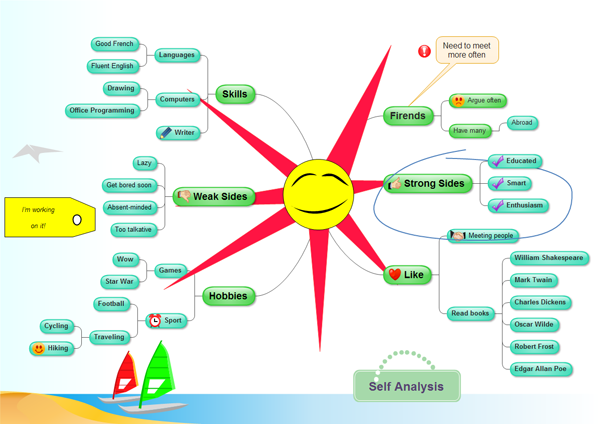
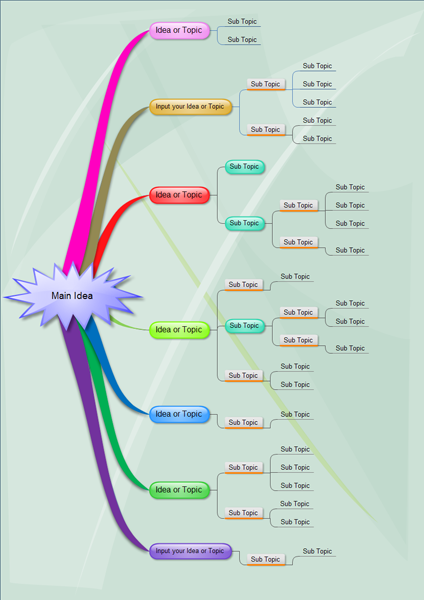
 Why Choose Edraw Max for it's Mind Mapping capability


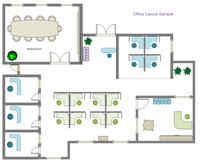
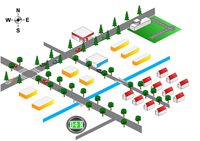
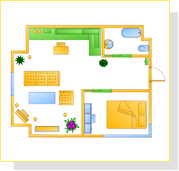
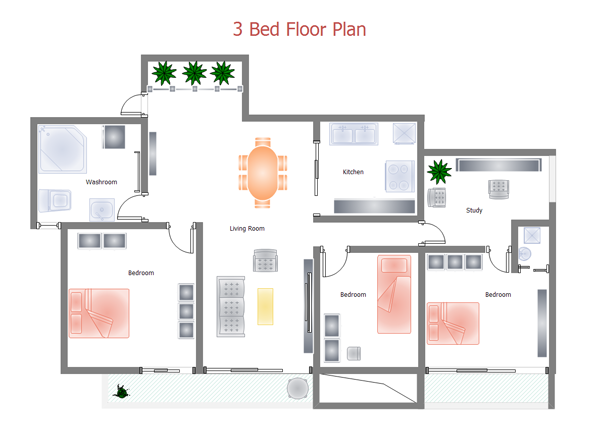
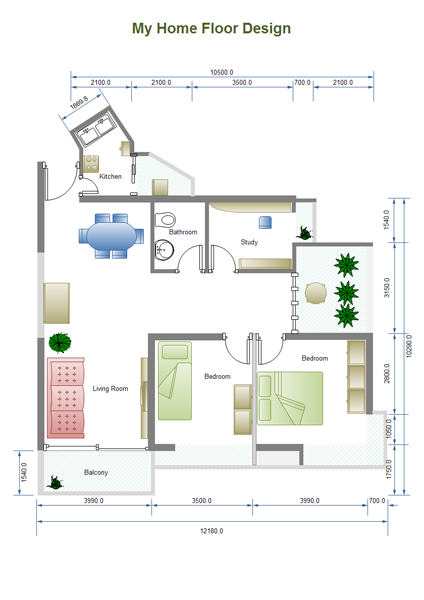
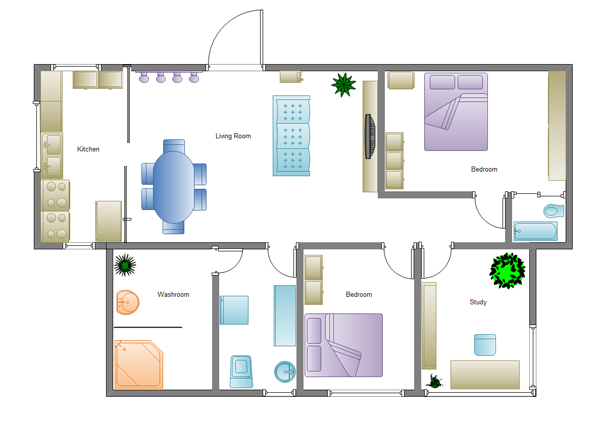
 Building Plan Software
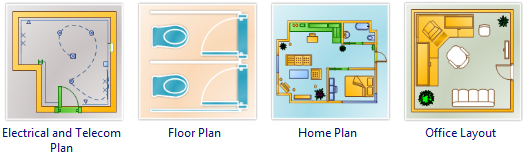


 Molecular Model Shapes
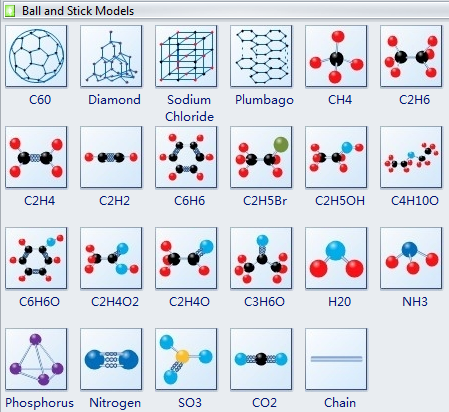


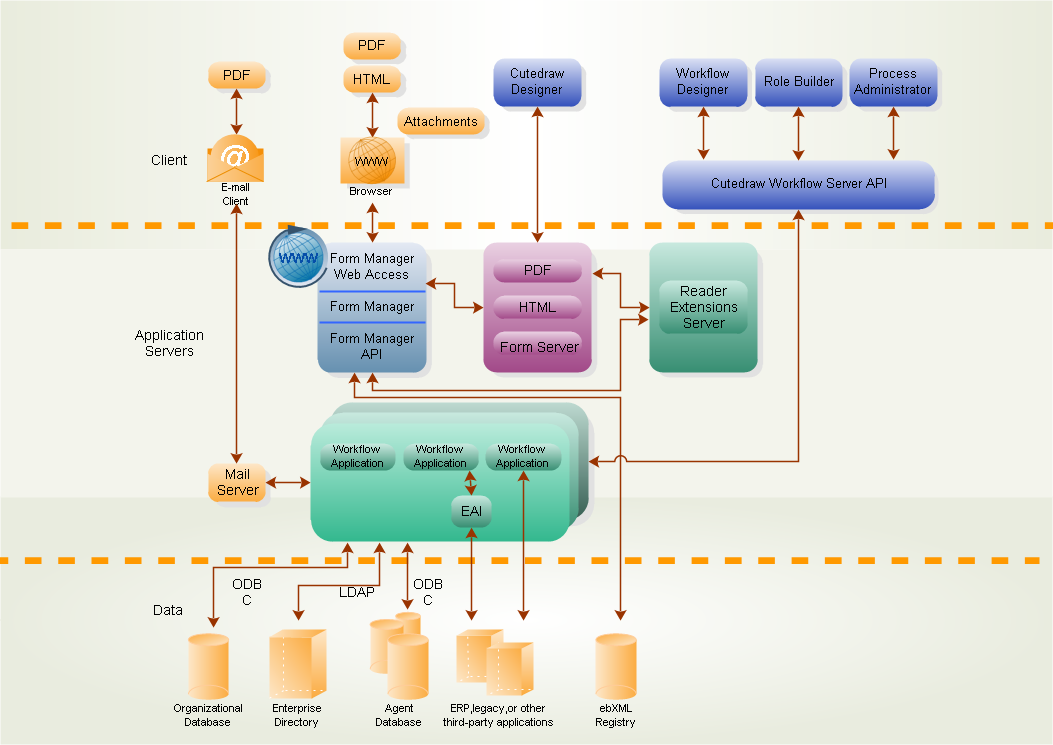
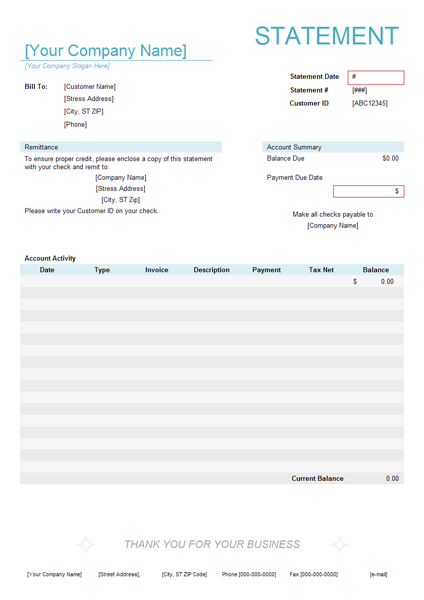
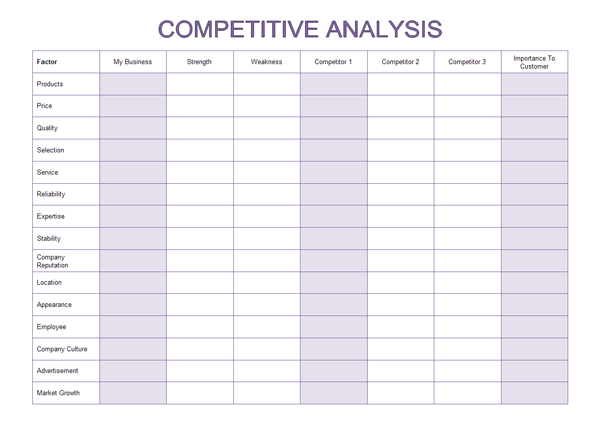
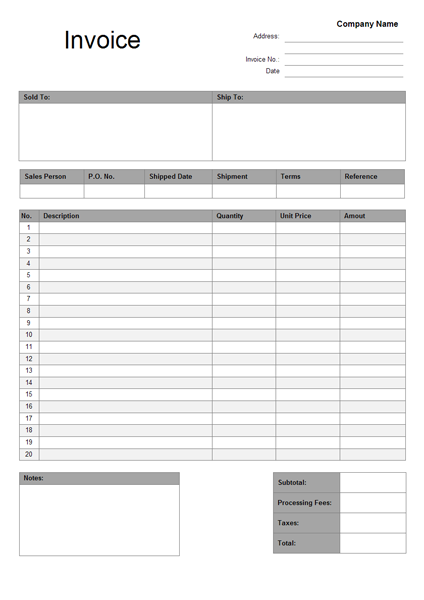
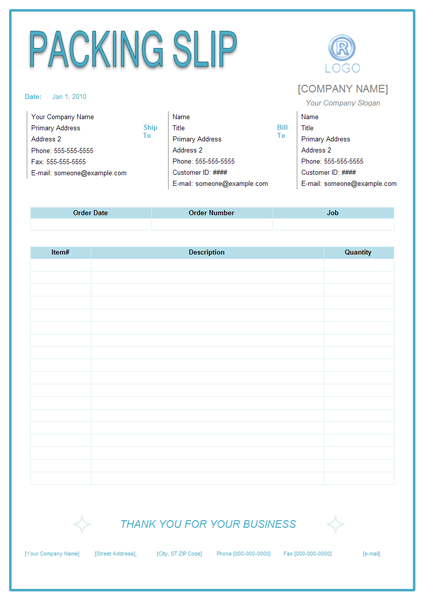
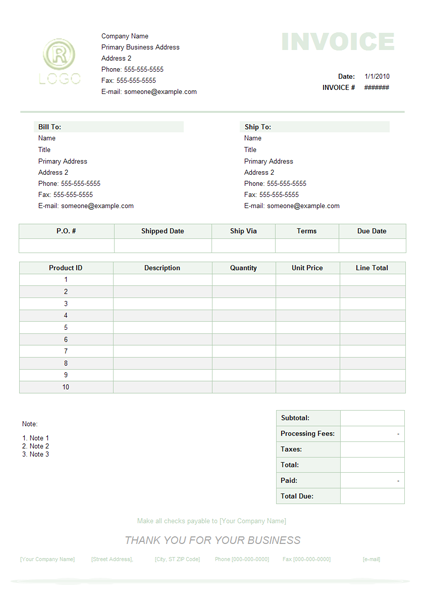
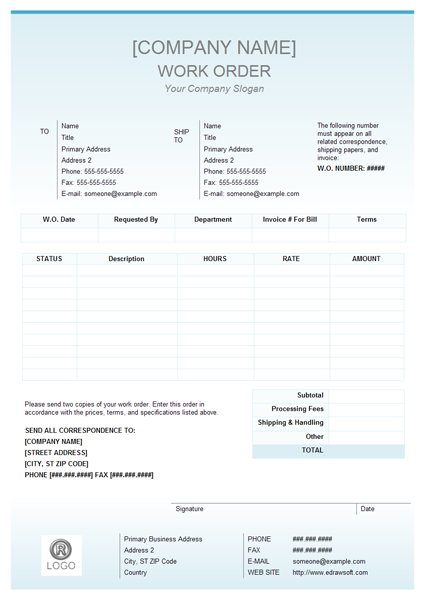
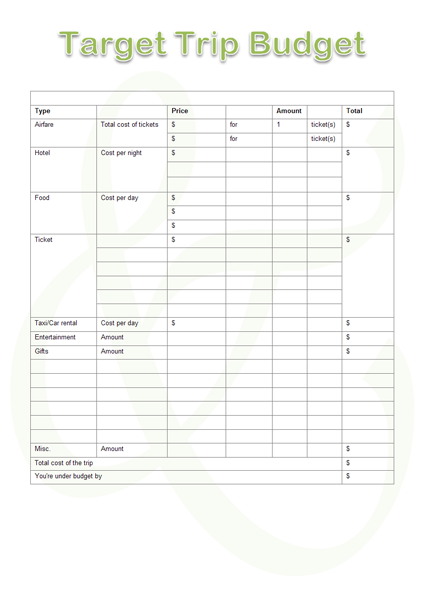
 Business Form Software
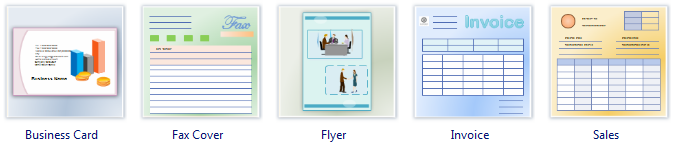


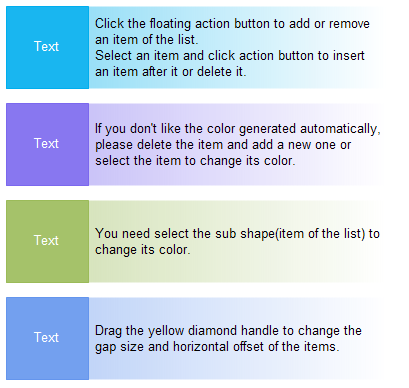
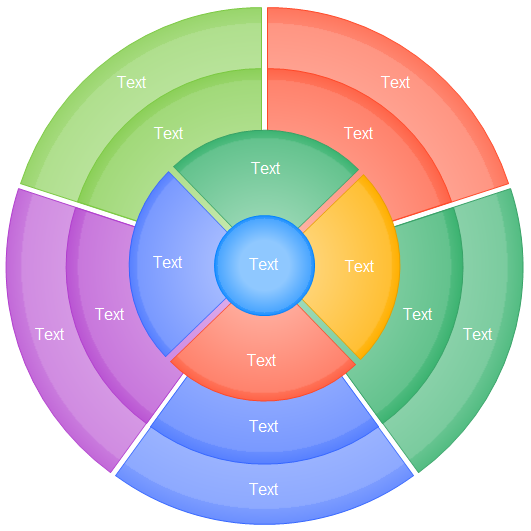
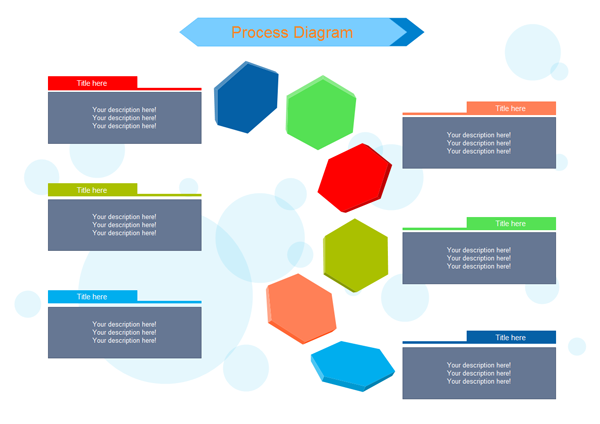
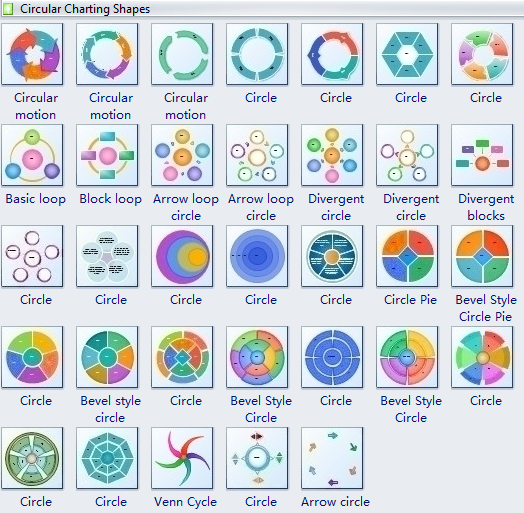 Charts and Graphics - List Shapes
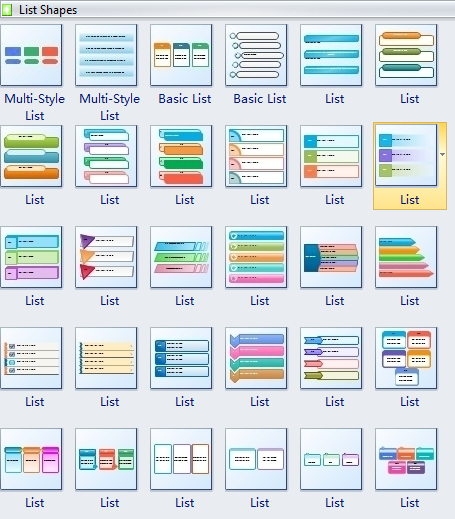 Charts and Graphics - Process Shapes
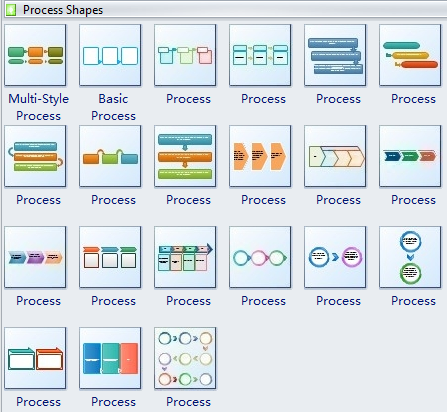

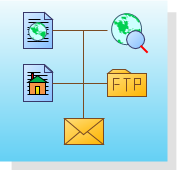
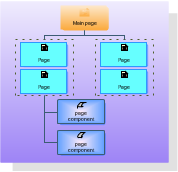
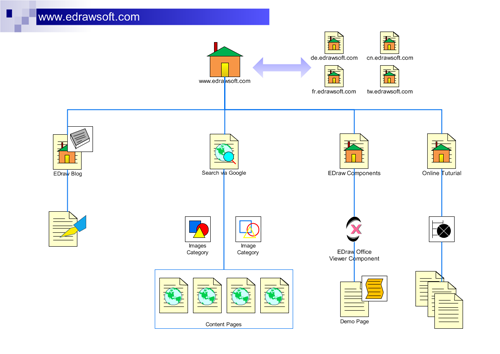
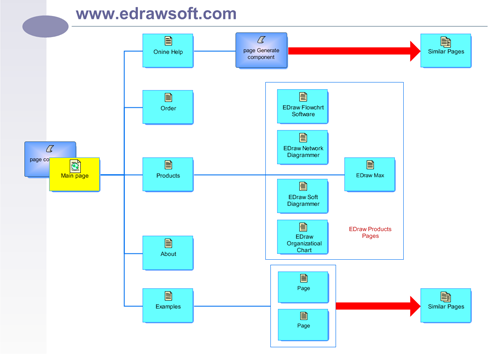
 Ready made Symbols for Conceptual Web Site
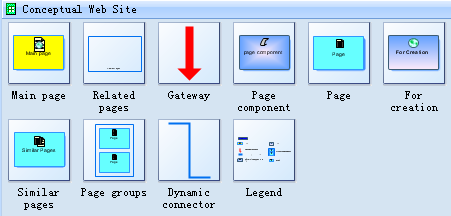 Web Site Map Shapes
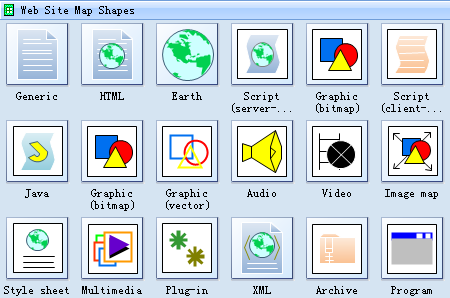
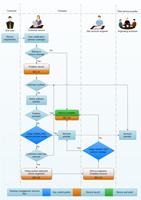
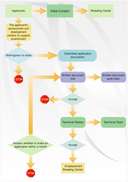
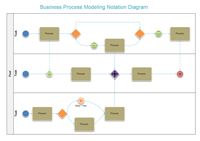
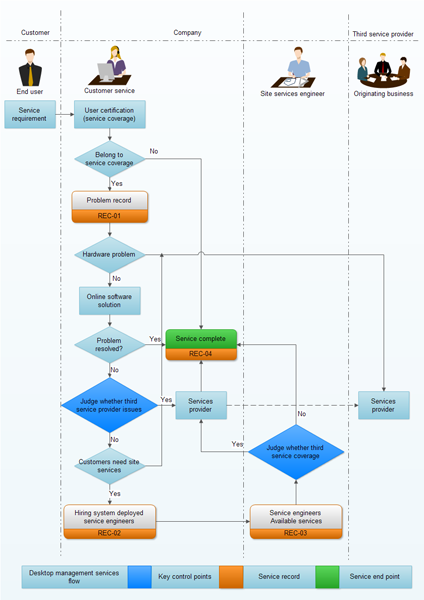
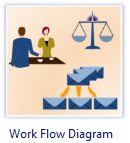
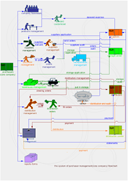
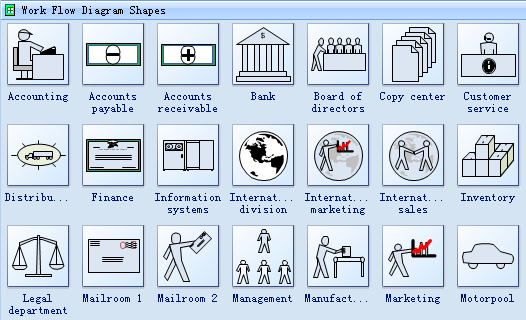
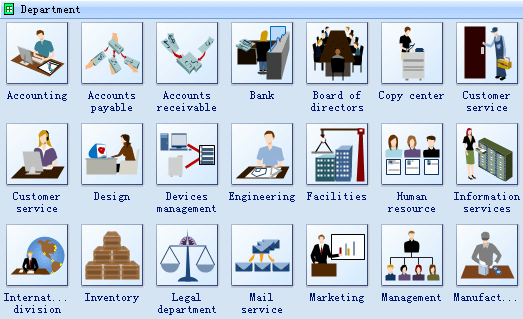
 Workflow Diagram SoftwareCreate workflow diagrams rapidly with rich workflow examples and templates. Provides some basic workflow knowledge and resource


 Database Diagram
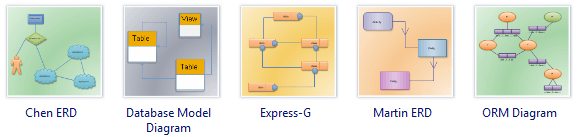
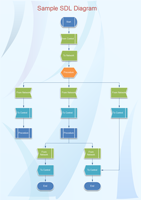
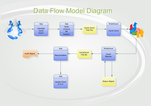
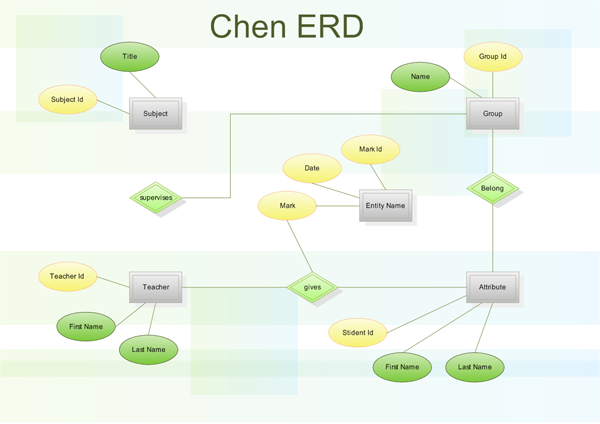
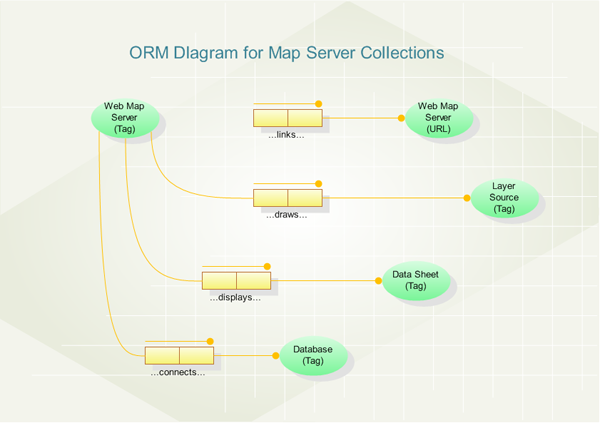
 Database Diagram ExamplesYou can review the following database diagram example created by edraw max. You can find the example in the software start page.
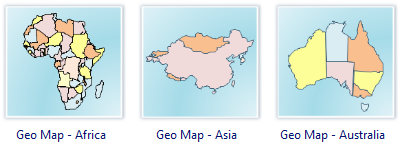
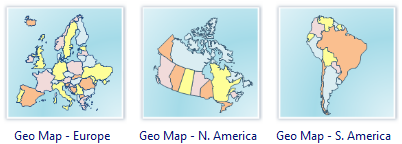
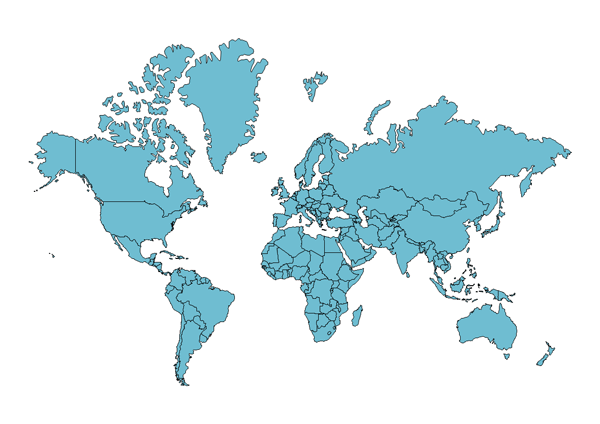
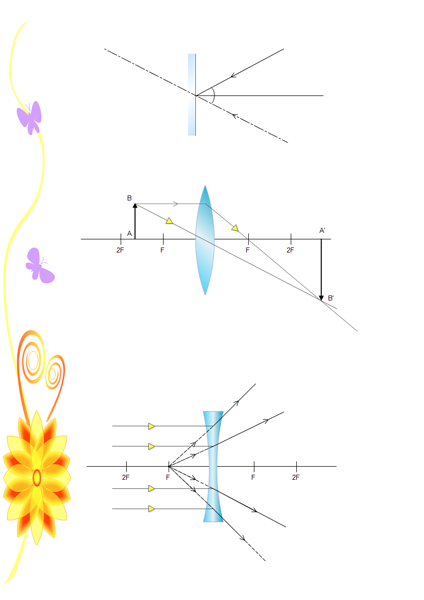
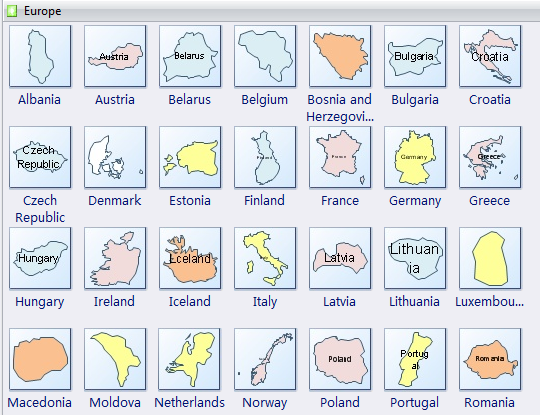 More Geological Mapping Shapes
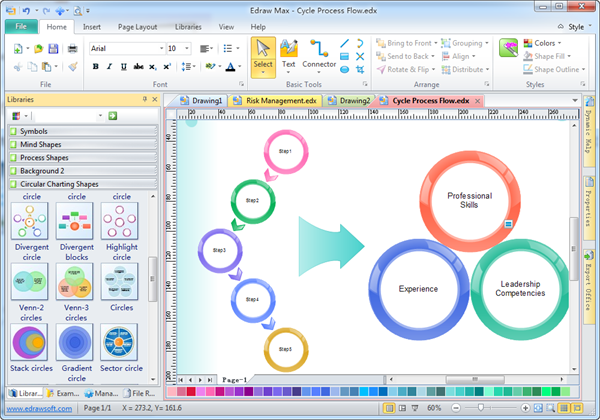
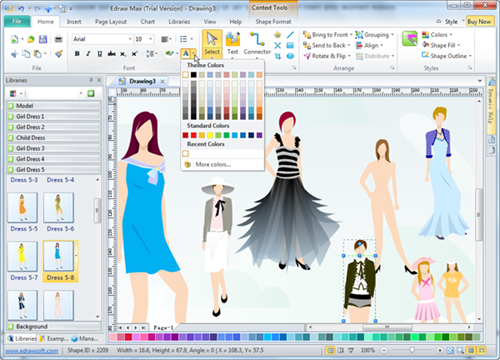
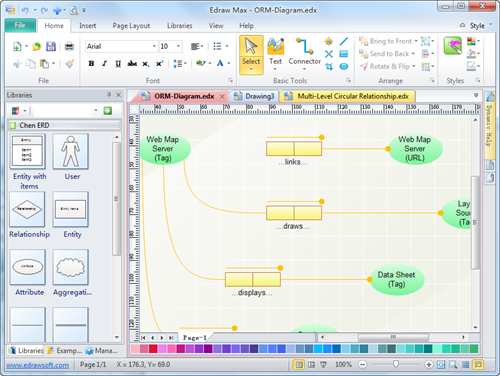
 Starting the Edraw ProgramThe Edraw interface has a similar look and feel to that of Microsoft Office 2010 programs. This makes it easy to locate features and easier for you to use Edraw with Microsoft Office programs, such as Microsoft Word PowerPoint. After you have installed Edraw, simply open it as you would any other Windows program. The following illustration shows the default Edraw window.
 If you don't get the above screen, please click File menu in the Top-Left corner.
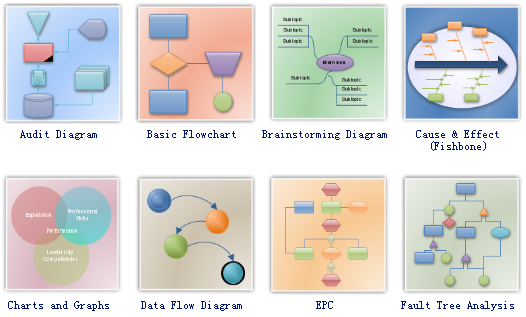
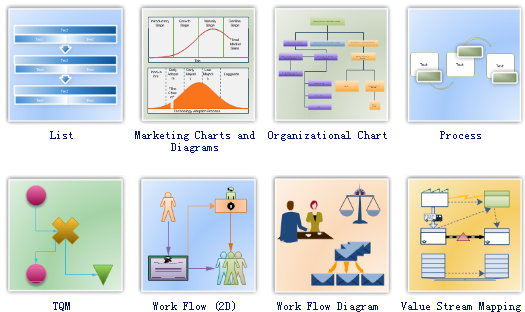
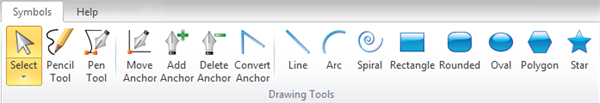
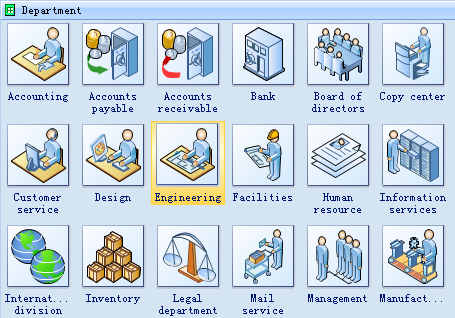
 To familiarize yourself with the many Edraw templates available, click a Template Category and hover your mouse over the Template pictures. Edraw will display a short description of the selected template in the lower-left corner of the window. To begin working with a template, simply position your pointer over the corresponding graphic and double click.Choosing a TemplateThe first step in creating any diagram is to choose your template. The template is your starting point - it provides you with the drawing tools (e.g., shapes, arrows, titles, and backgrounds) that you can use to create your diagram.
 Office Style Like Drawing EnvironmentAfter you open a template, you'll see the drawing environment, which includes menu category, template with shapes, drawing page, and a help pane on the right of the drawing page (F1).
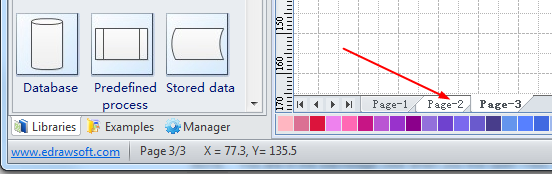
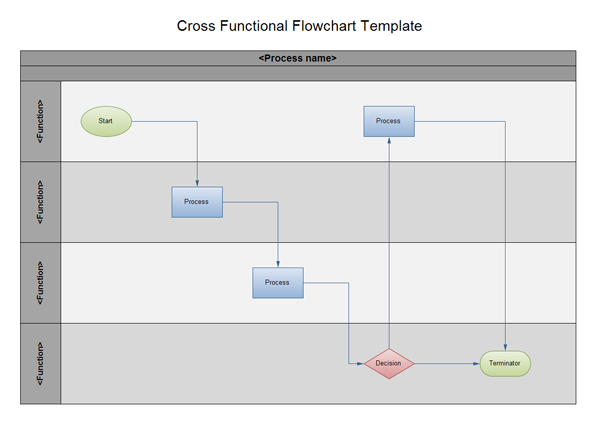
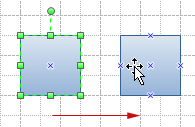
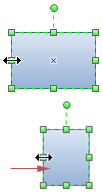
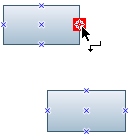
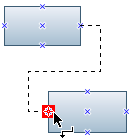
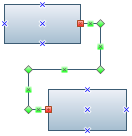
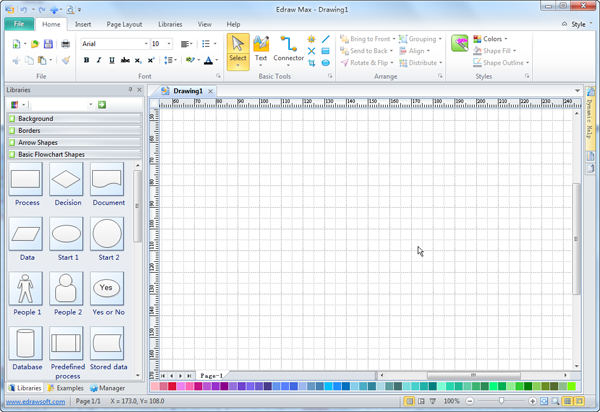 You can create your drawing on the drawing page, which represents the printed page and includes a grid to help position shapes. Edraw menus are similar to those in Microsoft Office 2010 System programs, so you'll find familiar ways to open, print, and save your diagrams.Creating a FlowchartFirstly you can drag the shapes (process, decision, data shapes) and text to the shapes. Then you add the connecting lines between the shapes. Next you may want to add free form text to the diagram, such as a title or comments.Adding ShapesAdd shapes to your diagram by dragging (hold down the left mouse button and move your mouse) shapes from templates in the Libraries window onto the drawing page. Don't worry too much about lining the shapes up. Edraw helps you line up the shapes by "snapping" them to the Drawing Page grid. Please note that the grid shown on the drawing page does not print out when you print the diagram.Deleting ShapesDeleting shapes is easy. Just click the shape and then press the DELETE key.Move and Resize ShapesMove a shape
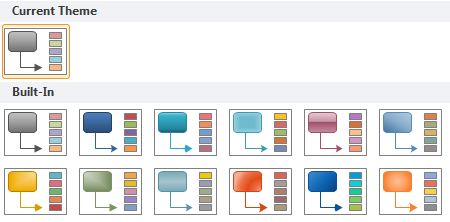 Edraw provide several predefined document themes, but you can also create your own by customizing an existing document theme, and then by saving it as a custom document theme.Saving the DiagramAfter you finish a diagram, you can save it the same way you save a file created in any Microsoft Office System program.Note It's a good idea to periodically save your diagram as you work.