
 RiskyProject Professional 5.0
Project managers can use RiskyProject for planning, scheduling, quantitative and qualitative risk analysis, and performance measurement of projects with multiple risks and uncertainties. RiskyProject Professional includes all the RiskyProject Lite: Monte Carlo Schedule Risk Analysis capabilities and more:
- Supports the complete project risk management life cycle:
- risk register
- risk ranking
- customizable risk matrix
- risk response and mitigation plans
- risk mitigation waterfall chart
- comprehensive risk properties
- risk status and risk review
- risk history
- Comprehensive quantitative cost and schedule risk analysis:Advanced project tracking with risks and uncertainties
- conditional and probabilistic branching
- probabilistic cash flow analysis
- cost analysis diagrams
- crucial tasks diagrams
- risk bubble chart
- success rates view
- probabilistic calendar
- Advanced project tracking with risks and uncertainties
- “What if analysis” with risks and uncertainties using multiple baselines.
 RiskyProject Lite 5.0
RiskyProject allows project managers to perform project planning, scheduling, quantitative risk analysis, and performance measurement of projects with multiple risks and uncertainties.
RiskyProject Lite is designed for project managers without advanced knowledge of risk analysis theory. With it, you can create a project schedule or use project schedule from Microsoft® Project, Oracle® Primavera, or other project management applications. Once you have your schedule, just define your risks using risk register and calculate the schedule to determine your risk profile.
RiskyProject Lite is:
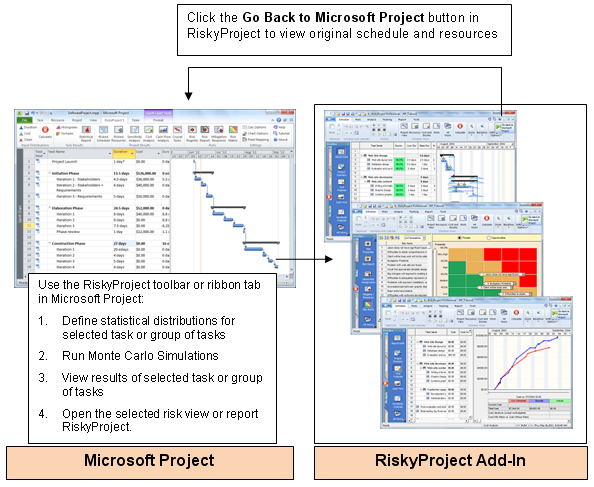
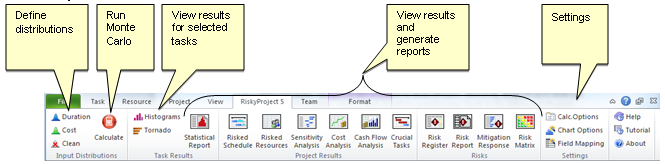
- Integrated Monte Carlo risk analysis for Microsoft® Project
- Integration with Oracle® Primavera and other project management software
- Replacement for Risk+
- Multiple statistical distributions for task duration, cost, start time, and lags
- Risk events
- Risk Register
- Risk adjusted project schedule
- Probabilistic resource allocation
- Correlations between task durations and cost; risk event correlation
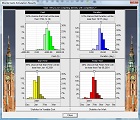
- Histograms and Cumulative Probability charts for all major project and activity parameters: duration, start time, finish time, and cost
- Tornado diagrams for project and each activity
- Multiple customizable reporting views
- Project tracking with risks and uncertainties
- Easy to use, no programming required!
RiskyProject Lite and RiskyProject Professional
RiskyProject professional features advanced risk analysis functionalities: project planning, scheduling, quantitative risk analysis, and project performance measurement. RiskyProject Lite has the same project scheduling and performance measurement functionalities, but it includes only basic quantitative risk analysis functionalities.
| RiskyProject Features | Lite | Professional |
|---|---|---|
| Project Planning and Scheduling | ||
| Work breakdown structure | ||
| Gantt Chart | ||
| Resource and work management | ||
| Fixed and variable cost management | ||
| Constraints and deadlines | ||
| Multiple baselines | ||
| Multiple project, task, and resource calendars | ||
| Risk Management | ||
| Risk Register (risks and issues, threats and opportunities, open and close risks, risk properties, risk probabilities, impacts, and scores, search and filter risks based risk properties) | ||
| Schedule and non-schedule risks (schedule, cost, safety, quality, environment, technology, legal, etc.) | ||
| Customizable risk categories and outcomes | ||
| Easily assign risks to tasks or resources | ||
| Risk correlations | ||
| Risk templates (standard risk templates are included) | ||
| Types of Uncertainty | ||
| Risk events for tasks and resources (fixed or relative delay, fixed of relative cost increase, Task restart, End task, Cancel task, etc.) | ||
| Multiple statistical distributions for task duration, cost, income start time, and lags (Uniform, Triangular, Normal, Lognormal, Exponential, Rayleigh, Gumbel, Beta, BetaPert, Discrete, Custom, and others) | In MS Project Add-in | |
| Conditional branching (If-Then-Else analysis) | ||
| Probabilistic branching | ||
| Probabilistic calendar | ||
| Probabilistic moment of risk | ||
| Quantitative Risk Analysis | ||
| Monte Carlo Simulations | ||
| Global risks (for all tasks or resources) | ||
| Local risks (for selected task or resource) | ||
| Event Chain Methodology support | ||
| Cost analysis with risks and uncertainties | ||
| Simulations until convergence | ||
| Analysis of success rate using project and task deadlines | ||
| Risk analysis for product lifecycle management | ||
| Sensitivity analysis (analysis how uncertainties affect project duration, cost, finish time, and success rate) | In MS Project Add-in | |
| Analysis of risk mitigation using multiple baselines | ||
| Reporting Tools | ||
| Customizable histograms and cumulative probability plots for task or project duration, start and finish times, cost, work, resource allocation, income and revenue | In MS Project Add-in | |
| Project information views (view original project parameters and results of simulation) | ||
| Result Gantt view (compare original project schedule with results of analysis) | ||
| Optimistic and pessimistic project schedules | ||
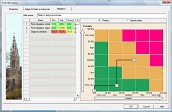
| Customizable risk matrix: Risk probability vs. impact | ||
| Risk report view | ||
| Cash flow view | ||
| Critical risks | ||
| Crucial task view | ||
| Risk mitigation (“waterfall”) diagrams | ||
| Success rate view | ||
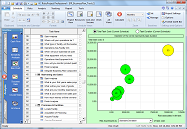
| Risk Chart view (task risk vs. task duration/cost chart) | ||
| Integration with other project management tools | ||
| RiskyProject Add-in for Microsoft® Project | ||
| Integration with Oracle® Primavera | ||
| Other Project Management Software: Safran Project, Project KickStart, FastTrack, WBS Chart Pro, PERT Chart Expert, and other project management software. | ||
| Tracking | ||
| Forecasting of duration of incomplete tasks with risks and uncertainties | ||
| Project tracking views | ||
| Software Help and Support | ||
| Free unlimited customer support via email | ||
| Online help and tutorial | ||
* third-party software should be purchased separately
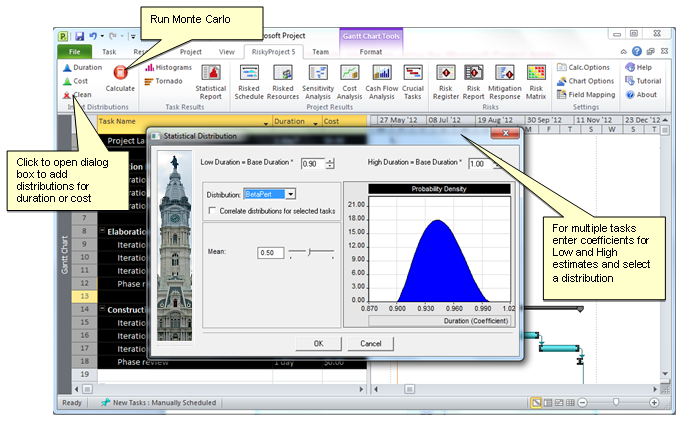
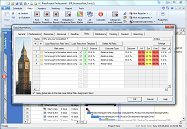 example, you could assign the risk "Budgetary problem" to all tasks that this risk could affect. Each risk assignment will have different probabilities and outcomes. For example, "Budgetary problems" assigned to task "Project elaboration" will have chance of occurrence 30% and outcome "Restart task".After calculation, the risk register will present calculated risk impact, risk probability and risk score, which is equal probability multiplied on impact. The risk register also may show probability, calculated impact and score of the risk after mitigation.The risk register can be exported and used for other projects.In addition to the risk register, uncertainties in the RiskyProject can be represented using statistical distributions.
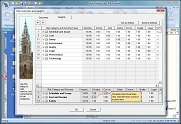
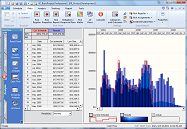
 Just double-click on each bar within the Gantt chart to view histograms for duration, start and finish times, and cost, associated with the particular task. Tracking Projects
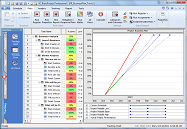 Because real-life data is sometimes the only way to assess your uncertainties correctly, tracking is one of the most important components of RiskyProject. To track a task, you enter the percentage of the task done on the particular date. RiskyProject then calculates the projected task duration and updates the risk profile of the task. The project schedule is recalculated to give you a more accurate estimate of total cost, project finish time, and duration. These new results are then presented in the Tracking Gantt Chart.Deadlines
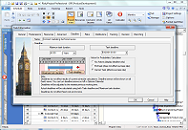
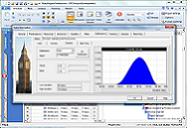
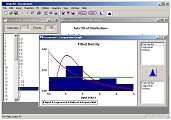 If you have empirical data related to cost, income, or duration, you can use it to generate a statistical distribution and use it in the analysis. RiskyProject uses Stat:Fit from Geer Mountain Software to generate statistical distributions.
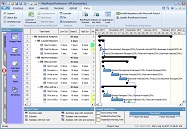
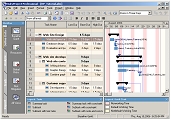 Task scheduling in RiskyProject is very similar to the process project managers use with traditional scheduling software and methodologies. The project schedule is based on tasks and is presented as a Gantt chart. The project manager specifies input project parameters, such as: duration, start and finish time, cost, etc., that are associated with a "best case scenario" outcome. You can use project schedule created in Microsoft® Project, Oracle® Primavera, or other project management for the risk analysis in RiskyProject.Resources and Costs
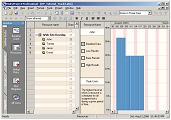 Project managers can then define work or material resources and assign them to tasks. There are two types of costs in RiskyProject: Fixed costs, which are associated with tasks, and variable costs, which are associated with resources. Costs associated with resources are calculated based on rate, units assigned, and task duration.Risk Register
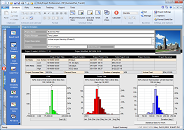
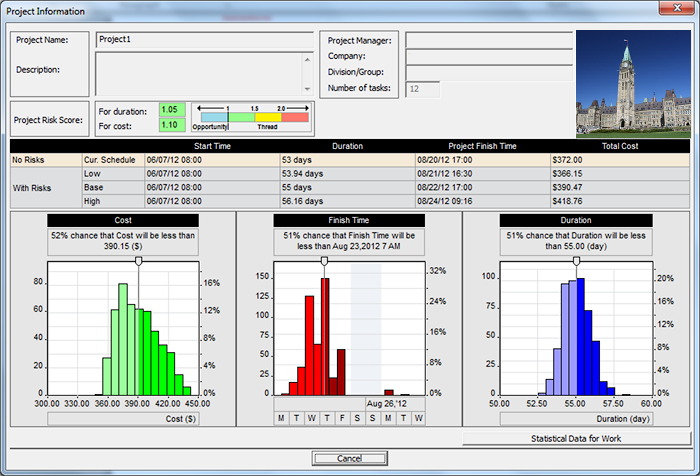
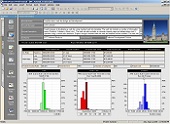 The Project Summary provides two different types of information. At the top, you can quickly view general information about the project, name, manager, description etc. The bottom section shows the results of the calculations without taking into account the project baseline. This information includes ranges for the project:
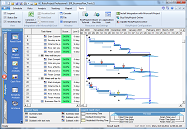
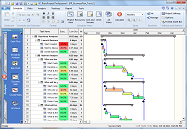
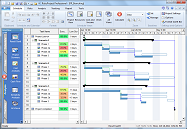
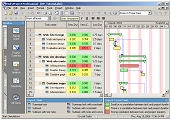
 The Result Gantt chart provides an easy way to view the low and high ranges for start and finish dates for each task. It also allows you to view the baseline and calculated project schedules side by side. This allows you to quickly determine how uncertainties affect each particular task.This is also an opportunity to perform a reality check. With the Result Gantt chart, you can easily see how the project schedule slips due to uncertainties and determine whether your initial estimates for the project and the risks and uncertainties were correct.Sensitivity Analysis
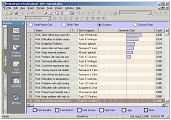 Sensitivity analysis determines which variables have the most potential to affect your project. These variables are:
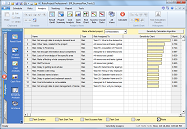
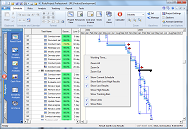
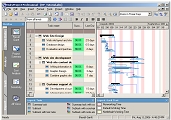
 The Crucial Tasks chart shows the results of the sensitivity analysis on a Gantt chart. Uncertainties whose duration has the most affect upon the total project duration are crucial tasks and are shown in red. By mitigating risks associated with crucial tasks, you can significantly improve your project's chance of success.Success Rate
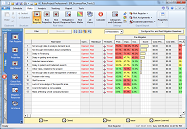
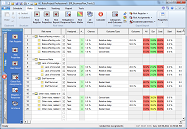
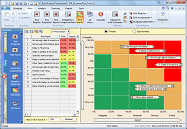
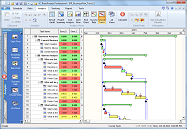
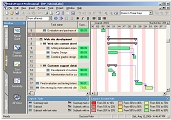 RiskyProject calculates every task's success rate or chance of completion. The results are shown on the Success Rate Gantt chart using different colors. Tasks with high success rates are green, medium success rates are yellow, and low success rates are red. You can cancel tasks, if a risk with "Cancel Task" outcome occurs, or if a task has reached a project or task deadline.
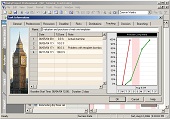 You can add information about each task. This is entered as the percentage of work done at a specific date. RiskyProject recalculates and shows an updated duration projection on a chart. Analyze Results with Tracking
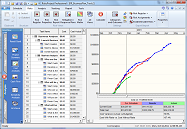
 After you add tracking data, you can recalculate your project schedule. RiskyProject applies the updated duration and chance of occurrence for risks. You can view the new project schedule on the Tracking Gantt chart. The Baseline schedule is also shown in the chart, so you can assess how your original estimates are different from actual project performance.
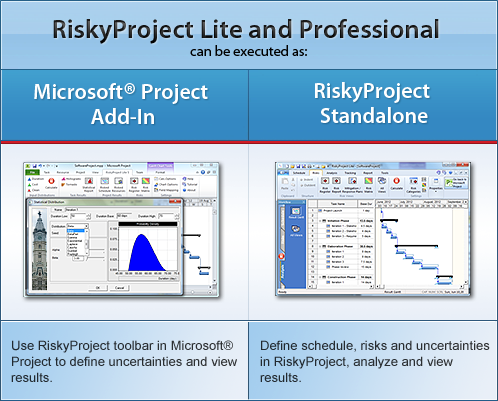
 The Aurora(TM) intelligent project scheduling software combines a variety of scheduling techniques, intelligent conflict resolution, and automated decision support to generate shorter schedules for resource-constrained critical-path projects. Almost 20 years of R&D have gone into Aurora's development, mostly to meet many of NASA's toughest planning & scheduling challenges. Aurora also includes the world's most advanced multi-project Critical Chain implementation. Aurora's scheduling engine can be seamlessly integrated with off-the-shelf scheduling tools (e.g., Primavera, MS Project, Deltek Open Plan); and can read and write data to RiskyProject.PROJECT RISK ANALYSIS WITH SAFRAN® PROJECT
 You project has a number of alternatives. During the course of a project, you can make different decisions, which may significantly change the project. Moreover, your project is also affected but a number of risks and uncertainties.
 Software's FastTrack Schedule 10 makes it easy to organize, track, and manage all project details. RiskyProject integrates with AEC Software's FastTrack Schedule 10 using an XML interface. Just export FastTrack's project schedule into XML format and open it in RiskyProject. You can then assign risks and uncertainties and perform quantitative risk analysis on the project.In this way, you can analyze the risk profile of FastTrack's schedules.WBS CHART PRO AND PERT CHARTS
 Chart Pro and PERT Chart Expert are used to present and modify project schedules in two different graphic formats. This software has been developed by Critical Tools. Both of these applications can be launched from the toolbar or from the menu. PROJECT RISK ANALYSIS WITH WELCOMRISK™
 is an enterprise qualitative risk management software. WelcomRisk allows you to identify and register risk, assign them to projects and activities, and track risks and mitigation efforts. List of activities can be created in WelcomRisk or imported from other project management software. RiskyProject can import data from Welcom Risk using the WelcomRisk wizard and perform quantitative risk analysis. Integration of WelcomRisk and RiskyProject allows you to perform analysis based on properly managed reliable risk databases. It helps to mitigate psychological biases, related to estimations of risks and uncertainties (see Event Chain Methodology).PROJECT RISK MANAGEMENT WITH PROJECT KICKSTART™
 Project KickStart from Experience In Software, Inc. Project KickStart is the fastest, easiest way to plan and schedule projects. It's unique in the world of project management tools, focusing on both planning a project and building a Gantt chart schedule. Project KickStart's 8-step planning icons focus your attention on the project structure -- goals, resources, obstacles and other strategic issues critical to your project's success. RiskyProject can use project plan created in Project KickStart. Moreover, results of the analysis can be imported back to Project KickStart. Project KickStart can be launched directly from RiskyProject.PROJECT RISK ANALYSIS WITH INTELLISYS PROJECT DESKTOP
 Project Desktop from Intellisys Inc. project management software lets you manage your projects from Mac, Linux, Unix or Windows. Access your projects from any location through a powerful interface. Enjoy transparent enterprise wide resource management and scheduling. Provide clients direct access to project status. Get all the features you really want, including WBS, Gantt charts, Pert Charts and more, without being distracted by features you don't need.RiskyProject can use a project schedule created in Intellisys Project Desktop to perform decision and quantitative risk analysis. Moreover, results of the analysis can be imported back to Intellisys Project Desktop.PROJECT RISK ANALYSIS WITH SCIFORMA PS8
 Dedicated to building innovative features within its software since 1982, Sciforma's PS8 provides the first PM software to fully implement Theory of Constraints and Critical Chain. PS8 capitalizes on over 20 years of experience in providing project management solutions in all areas of industry and government, including manufacturing, information sciences, construction, telecommunications, and research and development. From the smallest marketing campaigns to the largest space program, PS8 provides an abundant of features to keep your projects on schedule and on budget.RiskyProject can use a project schedule created PS8 in to perform decision and quantitative risk analysis. Moreover, results of the analysis can be imported back to PS8.PROJECT DECISION AND RISK ANALYSIS WITH MINDMANAGER™
 is the visual tool for planning, collaboration and business process management. The integrated solution of MindManager and RiskyProject can be used to define a project plan, assign risks and uncertainties, perform quantitative risk analysis, and present results of probabilistic analysis in MindManager. Moreover; if you have RiskyProject Professional and Vanguard's DecisionPro, you can perform a decision analysis: select a project alternative based on the plan created in MindManager.PROJECT RISK ANALYSIS WITH TURBOPROJECT™
 is a project management application for planning and managing simple and complex projects. RiskyProject can use a project schedule created in TurboProject to perform decision and quantitative risk analysis. Moreover, results of the analysis can be imported back to TurboProject. TurboProject can be launched directly from RiskyProject Professional and RiskyProject Lite. PROJECT RISK ANALYSIS WITH MILESTONES™
 Milestones by Kidasa Software Inc. is a project management and data presentation. Integrated RiskyProject/Milestones solution allows the project manager to produce presentation reports from RiskyProject schedule, manage large projects and coordinate team projects, format schedule to meet any reporting needs, publish the schedule on Internet.RiskyProject can use a project schedule created in Milestones to perform decision and quantitative risk analysis.Results of the analysis can be imported back to Milestones.
 Great Budget is the tool to rapidly build project budgets and integrate cost/ risk into the decision making process. Great Budget includes automatic budget calculating, advanced monitoring and tracking and CRIMS technology for risk identification and management. These technologies simplify budget building and validation and offer transparency for accurate cost estimation and management. RiskyProject can use information defined in Great Budget to perform project risk analysis.


